
Collaborators: Olivia Petit, Carlos Velasco, Andy Woods, Adrian David Cheok, & Charles Spence
Introduction
Previous research has demonstrated the existence of a number of crossmodal correspondences (Spence, 2011, 2012) between taste/flavour and specific visual attributes. So, for example, people have been shown to match tastes and shapes, and modified their taste evaluation according to the shape curvature of the package (Becker et al., 2011; Velasco, Salgado-Montejo, Marmolejo-Ramos, & Spence, 2014, see Velasco, Woods, Cheok, Petit, & Spence, submitted, for a review). Recently, the influence of shape curvature, symmetry, and the number of elements on shape-taste matches has been assessed (Salgado-Montejo et al., 2015). There are likely many more correspondences yet to be discovered. For instance, no study has yet assessed the correspondence between a taste and spatial elevation (up and down) and/or laterality (left and right). Nonetheless, the research that has been published to date on taste-sound correspondences suggests the existence of non-random associations between taste and vertical positioning, possibly, reflecting relative compatibility effects. Sounds have a spatial connotation, such that higher frequency sounds tend to be localized higher in space and lower frequency sounds associated with lower locations (e.g., Parise, Knorre, & Ernst, 2014). Sweet tastes are generally matchedwith higher-pitched sounds whereas bitter tastes are matched with low-pitched sounds (Velasco et al., 2014; Wang, Woods, & Spence, in press). In other contexts, sweet tastes and sour tastes are better expressed by means of high-pitched sounds compared to bitter and umami tastes that are better expressed by means of low-pitched sounds (Crisinel & Spence, 2010). Given crossmodal correspondences might be transitive (Deroy & Spence, 2013), the spatial-sound and sound-taste matches can be used to predict the spatial-taste mapping on the package.
Previous research has shown that the “heavier” locations are on the bottom-right of the package and the lighter locations are on the top-left, suggesting vertical-lateral location matches (Deng & Kahn, 2009). Here, we want to evaluate whether non-random associations between basic tastes and vertical and horizontal positions exist, and, if so, whether such crossmodal correspondences can be used to modulate the consumer’s product expectations via the design of the product packaging. In the first experiment, we use a crossmodal matching task in which the participants are given taste words and are asked to match them to the vertical and horizontal plane (using visual analogue scales). In the second experiment, we manipulate taste-space congruency via the elevation of design elements on product packaging in order to assess any influence on consumer product expectations.
Methods
Experiment 1
The taste words (‘bitter’, ‘salty’, ‘sour’, and ‘sweet’) were presented on the computer screen . The participants were asked to match those taste names in the horizontal and vertical plane through corresponding horizontal and vertical visual analogue scales ranging from 0 to 100. The four taste names were paired with each of the two scales and each pairing was shown twice, giving rise to a total of 16 trials. Trial order was randomised across participants. In every trial, the participants were asked to think of a food that has the taste presented in the trial, and to try to match it to a point on the scale.
Experiment 2
According to the results of Experiment 1, we propose to test whether the positioning of a food picture on a package can modify the taste perception and the purchase intentions. We used 4 packages, 1 for each taste related food picture: 1 candy bag (sweet), 1 coffee can (bitter), 1 bag of chips (salt) and 1 lemonade bottle (sour). The food picture was presented in 9 different positioning: 3 (left, middle, right) x 3 (top, middle, down). The four packages were paired with each of the 9 food picture positioning for a total of 32 trials (See Figure 1). The participants were asked to rate the food packages on 6 scales (one for each taste, one for the familiarity, and one for the purchase intentions) ranging from 0 to 100.
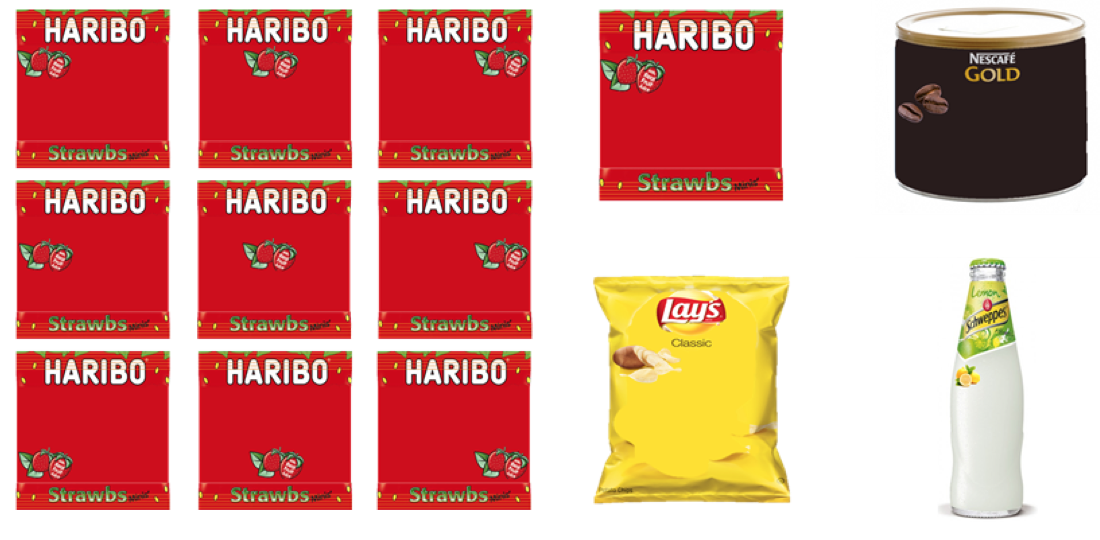
Figure 1. The 9 versions of the candy bag and the 4 types of packages.