
Collaborators: Olivia Petit, Carlos Velasco, Adrian David Cheok, Charles Spence.
Abstract
The development of neuroimaging techniques such as functional magnetic resonance imaging (fMRI) has provided marketers with the possibility of studying changes in brain activity in relation to marketing information (packaging, pricing, promotions, etc.) and decision-making. When consumers interact with a product, the brain captures and stores the related sensory experience in a multisensory representation in memory. Such memories serve consumers when making their future decisions. Thus, the senses play an important role in consumer behavior and the results of fMRI studies provide an interesting way for sensory marketers to analyze how the brain processes sensory information affecting product perception. In this article, we show how multisensory information, as well as mental simulation, impact taste expectations and subsequently taste, or bettersaid, flavor, perception. First, we discuss how neural analysis can help to understand the effect of marketing information on taste perception (Fig. 1). After that, we highlight the role of mental simulation on food perception in light of the latest fMRI findings (Fig. 2). To conclude, we explain how neuroscience might improve the understanding of crossmodal correspondences in the context of consumer sensory experiences (Fig. 3).
Keywords: Sensory Marketing, Consumer Neuroscience, fMRI, Food, Crossmodal Correspondences.
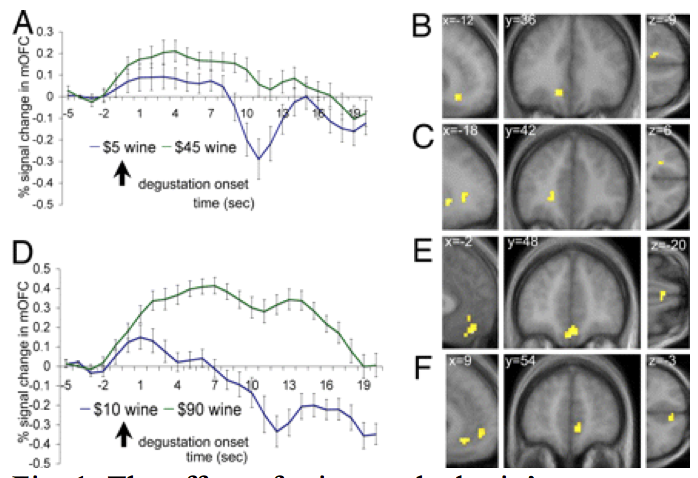
Fig. 1. The effect of price on the brain’s response to the taste of wine. (A) Wine 1: averaged time courses in the medial OFC (B) Wine 1: activity in the mOFC was higher for the high- ($45) than the low-price condition ($5). (C) Wine 1: activity in the vmPFC for the same contrast. (D) Wine 2: averaged time-courses in medial OFC voxels (E) Wine 2: activity in the mOFC was higher for the high- ($90) than for the low-price condition ($10). (F) Wine 2: activity in the vmPFC was higher for the same contrast, used in Plassmann et al.’s (2008).
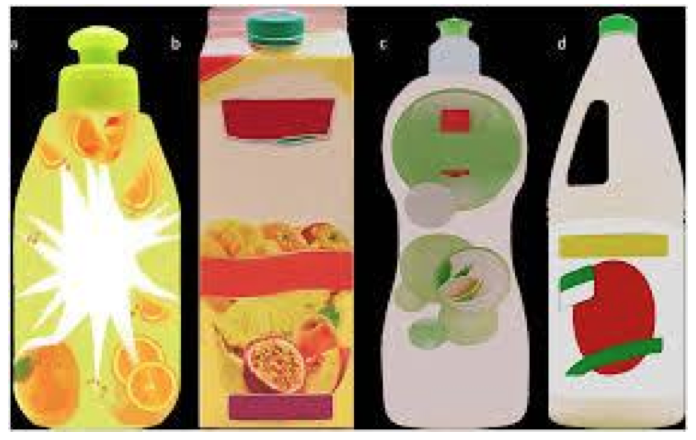
Fig. 2. Visual stimuli in the fMRI experiment. (a) Standardized food imitating product (b) Standardized fruit juice (c) Standardized household cleaner (d) Standardized bleach. (a–d) used in Basso et al.’s (2014).
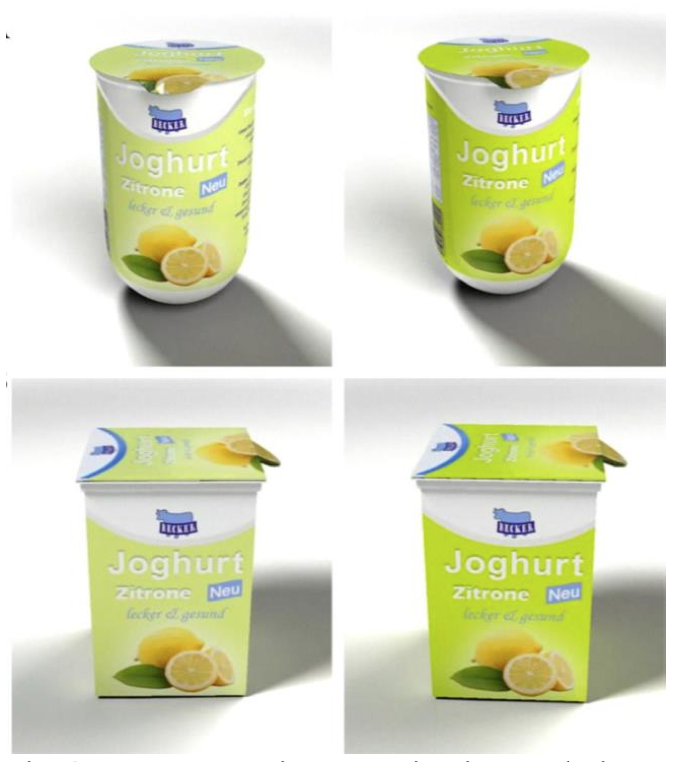
Fig. 3. Yogurt containers varying in angularity and color saturation, as used in Becker et al.’s (2011) study [18].